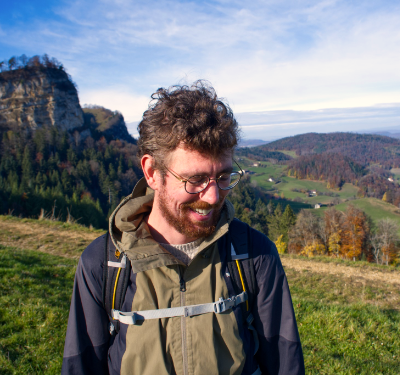
Yesterday I handed in the final version of my PhD-thesis. The cliché is true: it felt so great to finally have this booklet in my hand!
You can find the thesis here.
Yesterday I handed in the final version of my PhD-thesis. The cliché is true: it felt so great to finally have this booklet in my hand!
You can find the thesis here.
The past week I have been busy preparing my lectures and practical for the model-based summer school 2017. It was great fun to meet these students and I have learned a lot myself, setting up the practical. Rather than using a dataset of Birte’s lab, this year I used three datasets from openfmri.org, which are already in the BIDS-format. This makes it very easy to use open source tools like fmriprep.
I was very impressed how easy it now is to run very sophisticated preprocessing workflows, using a plethora of neuroimaging software packages and libraries, using the virtual machine approach of Docker and Singularity. On the LISA cluster it was a bit more challenging. Because Singularity automatically mounts your $HOME directory, the packages installed in the container then starts looking for dotfiles (.local/lib/python) it should not use. A solution is to (temprorally) rename your .local-folder, or use something like this, where we overwrite an environment variable (PYTHONUSERBASE) in the virtual environment:
SINGULARITYENV_PYTHONUSERBASE=<some_bogus_folder> singularity run -B /run/shm/:/run/shm/ -e poldracklab_fmriprep_latest- 2017-07-20-11e274f76dc3.img /home/gholland/data/bistable /home/gholland/data/bistable/ derivatives participant --participant-label 01
The next thing that was really cool to look into is traditional massively univariate analyses in Python using nistats, a derivative of nilearn, developed in Paris and Berkeley.
Anyway, to see how to do an entire model-based neuroimaging-analysis in just a few dozen lines of code, have a look at the notebooks I prepared for the summer school here:
On SFN Neuroscience 2015 in Chicago I presented two posters.
One was about optimizing 7T fMRI in the basal ganglia during the stop signal task, the other one about modelling the HRF as to link its shape not computational cognitive models.
My paper with EJ Wagenmakers, Lourens Waldorp and Birte Forstmann on the ‘in limbo approach’ has been accepted in PLOS ONE. You can download the latest version here.
For a project I needed T2*-values for different tissues. These can be estimated by using T2-weighted images with different echo times (TEs).
Some free tools exist like the Mipav-based CBS-tools and the web-based MRI Toolbox, but the Mipav toolkit is rather unstable (Java, …) and needs everything to be in a very specific format. And desptite that I think web-based neuroimaging analysis is very cool, the MRI toolbox is not very flexible yet (you have to manually enter the measurements).
Therefore, I set out to find out what this T2(*)-fitting actually does. Basically it fits the following signal decay function:
$$S(TE) = S_0 e^{-TE/T2(*)}$$
Last week I presented my poster “An antidote to the imager’s fallacy, or how to identify brain areas that are in limbo” at the Organization for Human Brain Mapping conference in Hamburg. A wonderful week with many inspiring talks and meetings. You can download my poster here.
de Hollander, G., Keuken, M. C., Bazin, P.-L., Weiss, M., Neumann, J., Reimann, K., Wähnert, M., Turner, R., Forstmann, B. U. and Schäfer, A. (2014), A gradual increase of iron toward the medial-inferior tip of the subthalamic nucleus. Hum. Brain Mapp.. doi: 10.1002/hbm.22485 (pdf)